A few months ago, around the time of our fifth birthday, we got an email through the contact form. (We are as surprised as you, but occasionally people do send us email.)
 We tried ignoring it, which is our usual policy, and I think it actually sat for a day or two before anybody noticed that the return address was “@wired.com”. I was between binge-watching ST:TNG on Netflix and… binge-watching The West Wing on Netflix, which turned out to be strangely apropos when I wrote back to find out that Wired was planning to feature a package of TV articles about what we have called the (second) golden age of television and what they’re calling the “Platinum” age. They had seen the Law and Order Databse, and wondered if we couldn’t contribute something analytical.
(Their thesis has to do with the availability of multiple channels of distribution coupled with the availability of so-called Big Data, and you’ll have to read the whole package of articles to see what you think about it. Around here, it’s well known that I have my own ideas about what’s happened to TV in the last decade, and think that larger-scale economic forces have something to do with the shift. Whatever. As the Romans might have said if they were straining hard for an erudite joke at five past midnight, De tellybus non est disputandum. But I digress.)
I’ve been reading Wired since volume 2, so to say that I was as thrilled as an overthinker can be is maybe a bit of an understatement. The whole team was thrilled, in fact, and we immediately put our heads together to pitch ideas. It was an interesting experience—we’ve never actually written anything for OTI on assignment. That’s not how this site works: the permanent writers pretty much follow their bliss, and we trust that good things will happen. As typically happens when we brainstorm, we went way overboard.
Given the thesis that TV is higher-quality these days than at any point in the past, we thought it stood to reason that it would be smarter. Our first idea was to download massive quantities of TV transcripts (they’re available online for purposes of closed-captioning), for the top 5 most popular (by ratings) and most prestigious (by Emmy awards) TV shows in five year intervals for the last thirty years. (We’d done a project involving transcripts before.) I actually wrote a small computer program (OK, it was two sed commands in a bash script) to strip out irrelevant elements form the transcripts and prepare them for analysis, and we learned all about the Flesch-Kincaid index. The idea was to demonstrate that TV is more linguistically complex than it used to be.

Looooong story short: It isn’t. Thirty years ago most TV scripts required about a 2nd to 3rd grade education to comprehend. Today, they require… about a 2nd to 3rd grade education to comprehend. We were a little dispirited, and not just because we’d already put in more than a few late nights.
(I’m thinking we could return to this idea. Analysis of the length or complexity of raw words and sentences can’t account for higher-order conceptual complexity in the plotting of tv shows—the sort of thing Steven Johnson describes in Everything Bad is Good for You with a couple of charts that track different plot threads in episodes of three representative series. Raw linguistic analysis also can’t account for the moral complexity of the shows, and the trend toward Shakespearean anti-heroes who are Not Good People—some downright sociopathic—but who are still sympathetic and compelling: Tony Soprano, Nancy Botwin, Walter White, Patty Hewes, or Don Draper may have a 3rd grade vocabulary, but they don’t have a third grade sensibility. But I digress.)
In any case, we were looking for a line that went up, and our line was flat. (I know, I know; a lot of blogs have that problem, it’s nothing to be ashamed of.) So we tossed what we had and started over. See also: The File Drawer Effect.
As we were brainstorming new ideas, we realized that we were coming up against a fundamental problem: We were making a lot of assertions based on received ideas about how TV is higher quality and more diverse than it had been in previous years; were we even sure of that premise? Before we started making outlandish claims, didn’t we need to quantify that?
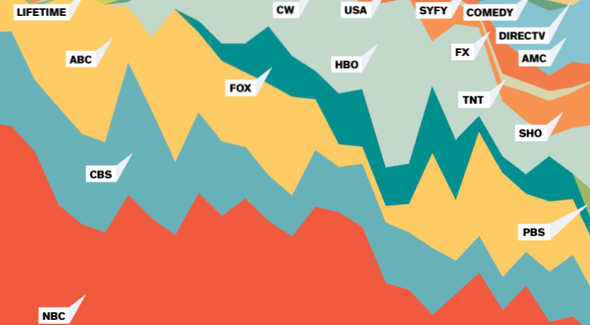
We ended up submitting to Wired data that are the basis of this chart:
The graph tracks the percentage of Emmy nominations awarded to a television network in a given year. it tells a lot of stories: The fall of NBC, the rise of HBO, and the subsequent fragmentation of cable. Last year, the broadcast networks were out-nominated by cable, which was unthinkable back in the mid-80s. We did some work related to ratings—and wrote a much longer article— that didn’t make it into the final product, but here’s a fun fact: The top rated show of the 2011–2012 TV season wouldn’t have made it into the top thirty back in 1981–1982.
So anyway. This whole post is to say: We did this, we think it’s really neat, and we’re finally glad that after months of keeping our mouths shut, we can tell you about it. Let us know what you think!
More Competition = Better TV | WIRED
A postscript: One of the unexpected gems we found during the research is Brooks and Marsh’s The Complete Directory to Prime Time Network and Cable TV Shows, 1946-Present, the standard reference work for prime time TV. I bought a copy. No overthinker’s library is complete without it.


Nice job, guys! I’m perpetually a few episodes behind, but was enjoying podcast #244 on my way to work this morning. Haven’t missed one yet :)
What is being represented in the charts of the “three representative series”? Presumably the columns represent time, but without a label for the vertical axis or a legend for the box shadings it’s hard (for me at least) to figure out what the charts are supposed to depict.
Each row on the vertical axis represents a sub-plot of the episode, and it’s shaded based on whether the sub-plot is referenced in a that time-interval.
“Thirty years ago most TV scripts required about a 2nd to 3rd grade education to comprehend. Today, they require… about a 2nd to 3rd grade education to comprehend. We were a little dispirited, and not just because we’d already put in more than a few late nights.”
Nooooooooo!
Wrong scale.
To say a text requires of the reader completion of post-secondary matriculation rather than, or should I say instead of, achievement of no more than mid-primary-grade-level educational attainment (which most post-neonates accomplish prior to loss of even half of the deciduous teeth, is most emphatically not to say it is an equivalency to its, the text’s, splendiferous linguistic or grammatical and/or vocabulary-dense extravagance.
Better to say a text’s readability index measures the level of education needed to untangle it.
tfl
I don’t get the “fun fact” – in what way would it not have made it into the top 30? And doesn’t that imply that television was better thirty years ago than it is now (if our best today wouldn’t have been good enough back then), rather than the reverse?
Congratulations, you win the D’AWWWWW award for Underthinking.
The answer to your question is that the top rated shows nowadays have way worse ratings than the top rated shows from years ago, not because they are worse (actually they are better) but because there are so many more available options for quality TV and for other entertainment now than there were then.
(Or, we could accept your argument and conclude that comic books were way better in the 90s than recently. After all, the sales were much higher!)
This is nit-picking, but don’t agree that the top rated shows of today are better than those of, say 1982. These days, sports, news, and reality score big in the ratings department, whereas thirty years ago, it was scripted shows like Dallas and Cosby and M*A*S*H (surely one of the greatest series ever) who did the big numbers.
On the whole, I’d agree that our highest quality shows are better than those in the eighties, and not just because cameras are better, effects are cheaper, and HBO has legitimized T&A. The storytelling has gotten more sophisticated and more adult (by which I mean morally ambiguous, not sexy, though I guess it’s gotten that too).
But those don’t do big numbers outside the OTI demographic. Three and a half million people watched the Mad Men S5 premiere; 2.8 the recent breaking bad midway-finale. That doesn’t hold a candle to Two and a Half Men.
Maybe I should have been explicit that ratings, w/r/t TV, usually means Nielsen ratings, a measure of how many people were watching a given show.
A Nielsen ratings point represents one percent of television-equipped households in the United States. It’s usually reported with another metric called “share”, which is the percentage of total TVs in use tuned into a program.
The top-rated show of the 2011-2012 season, NBC Sunday Night Football, earned a 12.9 rating, while the top rated show of the 1981-1982 season, Dallas, did a 28.4. My point was that in 1982, the thirtieth highest-rated show was Fantasy Island, which scored an 18.3 — higher than the highest rated show in 2012.
Even assuming a rise in the number of TV-equipped households (though there is evidence that TV ownership has actually dropped off recently), that speaks to remarkable fragmentation in the TV landscape.
Wait, Lifetime network isn’t still getting nominations!?!?!??!
“We’ve never actually wrote anything….” Are you fucking kidding me?!? Do actually get paid to write like this?
Error corrected. Also, I think you meant,
“Do you actually get paid to write like this?”
Regards,
Teh edditor’s of Overthniking Ti. Who ocasionaley maek grammar and spelling mistake’s.
Sure we do. We just don’t get paid to proofread.
It’s like the undercoating on a used car…only the suckers pay for proofreading.
Buddy, they install the proofreading at the factory. Nothing we can do about it.
I grabbed some data from IMDB a few months ago and also was curious to see if TV right now really is better. As it turns out, I didn’t find a overall correlation to better scores, but scores of TV series in the past few years are overall more consistently high. This contrasts to older series where ratings are more hit or miss. Check out the details and my other findings here.