 It’s October, which means it’s time to subject the IMDB Top 250 Movies list to a level of quantitative scrutiny it probably doesn’t deserve. For those of you who are new to this series, here’s a quick recap: I’m four years into an effort to analyze changing movie tastes through lists of top movies.
In 2008, I compared the AFI Top 100 movies lists of 1998 and 2007 to the IMDb Top 250 movies list as of September 2008 and found the industry (AFI) list skewed towards older movies compared to the fan list (IMDb) and that the contents of the AFI list had only advanced by 5 years in the 9 years between the two editions.
In 2009 and 2010 I returned to the IMDb lists by taking snapshots of the list at around the same time of year as the initial analysis (late September/early October) and attempted to extrapolate some meaning from the changes in the lists’ composition over the years.
And now, in 2011, I’m adding a fourth year of IMDb data to the analysis! Will any trends emerge? Can we predict the future of the IMDb Top 250 list? Read on to find out.
Before we begin, I should state the obvious limitations to using the IMDb list as a tool for analyzing changes in movie tastes over time. The IMDb list is far from authoritative, and the potentially skewed demographics of its voters casts even more doubt on the validity of the list. Furthermore, the very exercise of assigning a single numerical rating to a movie is more than reductive; it’s borderline absurd. But put all of that aside for a moment. The IMDb list, for all its flaws, is well-known, and its ratings are accepted as being decent rough indicators of movie quality.
With that being said, let’s pick up where we left off last year, when I asserted that the IMDb list’s perceived bias towards newer movies was real, and getting worse over time. From last year’s article:
When I fired up Excel to do this analysis, I was pretty sure that I would find that the overall shift of the dataset in terms of median year would be greater than the concurrent shift in time. And I was right:
- Median Year of IDMb Top 250 List as of 9/30/2008: 1975
- Median Year of IMDb Top 250 List as of 10/18/2009: 1977 (jumps 2 years after 1 year)
- Median Year of IMDb Top 250 List as of 9/26/2010: 1981.5 (jumps 4.5 years after 1 year)
Yup, you read that right. Over the course of the last year, the median year of the IMDb Top 250 movies list increased by 4.5 years, which suggests that not only is the lists’ bias towards newer movies still present, it’s intensifying over time.
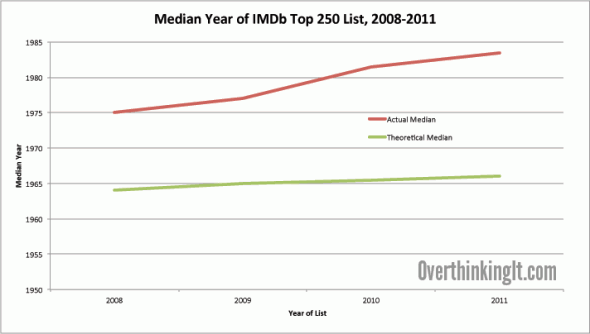
So how does the most recent sampling fit in with this trend? The list as of 10/3/2011 had a median year of 1983.5, or a jump of 2 years after 1 year. So the tilt towards newer movies wasn’t as severe as it was from 2009-2010, but it was more than what you’d expect if the movies were evenly distributed from the minimum to the maximum for each year.
Let’s see how that plays out in chart and graph form:
| Year | Min | Max | Actual Median | Theoretical Median |
| 2008 | 1920 | 2008 | 1975 | 1964 |
| 2009 | 1921 | 2009 | 1977 | 1965 |
| 2010 | 1921 | 2010 | 1981.5 | 1965.5 |
| 2011 | 1921 | 2011 | 1983.5 | 1966 |
(Note: the “theoretical median” = what the median year of the list would be if the movies were evenly distributed between the oldest movie on the list and the newest.)

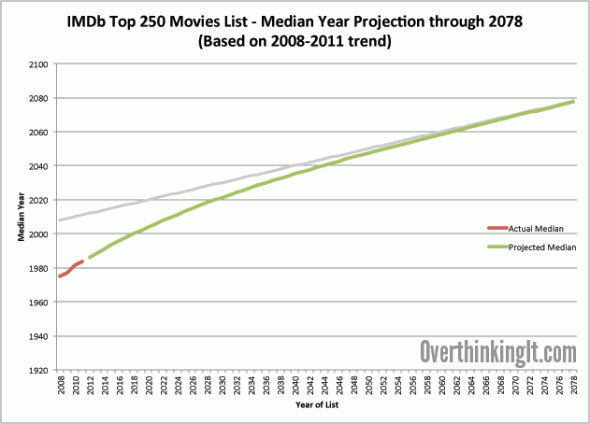
I thought it would be fun to make a rudimentary projection as to what would happen to this list based on the trend of the last 4 years. So I looked at the changes in differences between median year and list year: from 2008-2009, the difference reduced from 33 to 32; from 2009 to 2010, the difference reduced from 32 to 28.5; and from 2010 to 2011, the difference reduced from 28.5 to 27.5. Each change can also be stated as a reduction factor (e.g., 32/33 = .9697). Averaging these three factors produces a single average reduction factor of .9417, which, if you apply to future years, we can use to come up with the shocking prediction that the list’s median year will essentially equal the year of the list in about 70 years:

OK, calm down folks. You don’t have to be a statistician to see the problems with this approach. First, intuitively, it makes no sense. Can you imagine a top movies list in the year 2070 that has as many movies on it from all years prior to 2069 as it does for the years 2069 and 2070? Second, and more importantly, a sample size of 4 is way too small to make this sort of projection. (Also, my little trick of averaging reduction factors probably isn’t sound math, but it worked in that it produced the nice, albeit erroneous, graph you see above.)
About that sample size. Unfortunately, I’ve only been doing this for four years. Now, if only there were some way to go back in time and capture the status of the list from previous years. If only…
But wait! Such a thing exists. Some fortuitous Google searches led me to the “IMDB Top 250 History” website, which has snapshots of lists going all the way back April 1996.
Jackpot! I took additional snapshots from the same time frame, added them to the analysis, and…
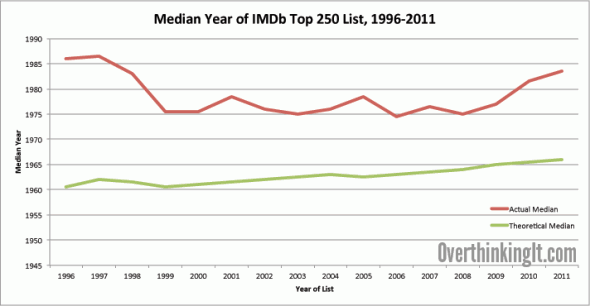
…was disappointed to find that the trend totally disappeared with the expanded dataset:
| Year | Min | Max | Actual Median | Theoretical Median |
| 1996 | 1925 | 1996 | 1986 | 1960.5 |
| 1997 | 1927 | 1997 | 1986.5 | 1962 |
| 1998 | 1925 | 1998 | 1983 | 1961.5 |
| 1999 | 1922 | 1999 | 1975.5 | 1960.5 |
| 2000 | 1922 | 2000 | 1975.5 | 1961 |
| 2001 | 1922 | 2001 | 1978.5 | 1961.5 |
| 2002 | 1922 | 2002 | 1976 | 1962 |
| 2003 | 1922 | 2003 | 1975 | 1962.5 |
| 2004 | 1922 | 2004 | 1976 | 1963 |
| 2005 | 1920 | 2005 | 1978.5 | 1962.5 |
| 2006 | 1920 | 2006 | 1974.5 | 1963 |
| 2007 | 1920 | 2007 | 1976.5 | 1963.5 |
| 2008 | 1920 | 2008 | 1975 | 1964 |
| 2009 | 1921 | 2009 | 1977 | 1965 |
| 2010 | 1921 | 2010 | 1981.5 | 1965.5 |
| 2011 | 1921 | 2011 | 1983.5 | 1966 |

Turns out that in its earlier days, the IMDb Top 250 list was even more skewed towards newer movies than it is today, both in relative and absolute terms. And even with the larger sample size, the swings in median year make any sort of projection unfeasible, whether it’s with my fuzzy math method or a more formal linear regression analysis. And we haven’t even factored in IMDb’s changes and tweaks to its ranking algorithm over the years.
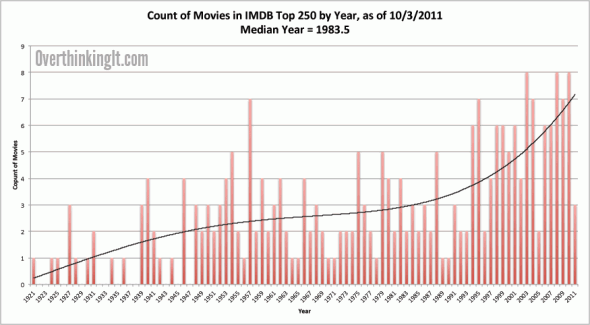
Sorry, folks, we can’t predict the future of the IMDb Top 250 Movies List through statistics. Or even make an educated guess. But we can still have a lot of fun analyzing the changes that have occurred to the list. Read on for more:

I know the dataset is likely too small, but does it implies that between 1998 and 1999 the imdb userbase started paying attention to more classic movies? Were there some big rereleases that year, perhaps, and now we are restoring the original 96/97 status quo?
Wasn’t the original Star Wars trilogy re-released in Theatres around that time?
I wonder how much influence Netflix Instant Streaming has on the new list.
Mulholland Drive OFF THE LIST???
Seriously, wtf??!
I think you’re missing a huge variable. The number of movies produced per year is now a lot higher than it was years ago. Therefore even if the average movie rating and variance stayed the same over time, you’d expect to see more recent films in the top 250.
I agree. The number of films being released per year in the states and abroad is much higher in the last 20 years than it ever was in the past. The rate at which technology can allow more and more film makers to make films of varying budgets is very high and although all the top 250 are big releases, it also means an increase the amount of films in existence, meaning the average score of all movies is skewed by the adding new scores and thus the population can manipulate scores based on changing tastes, with adjustments for population increases. Of course older films are going to get snubbed, especially when it becomes increasingly harder for audiences to find copies on changing formats. Does Netflix even have Arsenic and Old Lace? How many people today consistently watch films from before 1975?
Netflix has Arsenic and Old Lace, both DVD and streaming! I’m one of those weird people that most the movies I watch are older than 1975, with only a few newer ones thrown in.
Um…me? Joan Crawford and Katharine Hepburn are the s**t.
I see two possible reasons for the odd shape of the Historical Median graph (one for each end):
1- At the beginning, the IMDB was incomplete. It would take a couple of years to get every movie ever made entered in sufficient detail and rated accurately. The initial list would have had a bias toward newer movies because an accurate rating would have been easier to get.
2- As of late, there have been a large number of remakes of movies. These new versions of movies are taking precedence over the older originals. I suspect that people are mistakenly rating the new version of Straw Dogs when they mean to rate the original or vice versa. This would dilute the scores of older movies, allowing newer movies to push out both the new and old versions of remakes, thus skewing the the median.
Or it’s the political affiliation of the president.
So, in 2071, some of the top movies will be ones that haven’t been released yet? Since IMBD lets you post reviews and rate movies before they are officially released (e.g. “Red State”), it wouldn’t surprise me.
It might also be interesting to look at the rankings of specific movies as they change over time. What genre of movie is more likely to have a high initial ranking before falling off the Top 250 entirely? Do remakes or originals have more “staying power”? Which movies have a fairly constant ranking?
The number of votes back in 1996 is interesting – Empire Records comes in at 98th best movie ever, with 252 votes. Odd that it drops off the list after that, poor forgotten masterpiece that it is.
It would be interesting to see the data broken out by time period of the vote, on the assumption that IMDB’s user base demographics changed rapidly in the early days of the web. One could roll individual movies through into such a year breakout by treating the prior year’s cumulative votes as if they were all pegged at the prior year’s aggregate score.
The first step would be a rating difference like you calc’d for the ranking difference. Just eyeballing Empire Strike’s Back, for instance, the rating drifts upward from 8.1 in 1996 to 8.8 in 2011. Braveheart goes from 8.5 to 8.3 – I wonder if Mel Gibson’s movies started to drift south as his antics got crazier off screen.
I downloaded your generous excel workbook, but did you consider uploading it to Google Docs, so derivative analysis like that could be shared?
This effect might be buried by the number of votes, but it would be interesting to see how the release of the Criterion edition of a movie affects voting. Or director’s cuts that made significant changes, like the final release of Bladerunner without the narration and with the original score restored.
inmate has some reason in his first point. Early web access was not yet widespread and most of web surfers were colleague student (20-somethings)and older people which still represented a good percentage overall. Maybe this trend was still present until early 2000s.
Now we have web access available to anyone since kindergarten, more younger people vote in what they (can) see.
To add to what Jota and inmate mentioned, the issue of skewed demographics from 1996 until now is such a major factor in looking at the data that it almost in and of itself proves why the IMDB 250 is too weak to take seriously. So considering that the IMDB in the 90’s was more obscure than it is now, the demographics were probably mostly over 20. As internet usage increases over the years, the user base demographics skew younger and younger, meaning that even if they would love older movies, most of them haven’t even had a chance to see most of them yet in their lifetime. If the user base skews more towards younger viewers than older ones, their frame of reference for what they like and what they don’t like is much more limited. Even though the IMDB algorithm tries hard to account for this, it still falls victim to it more often than not.
I would think that Netflix would spur more watching of old movies. Years ago, the only options for watching a movie were going to the store or watching what was on TV and both of those were biased towards newer, more recognizable movies.
In the Netflix era, anyone who reads a reference to an old movie online or reads a “Best Movies Ever” type of list can immediately go to Netflix and order/stream an older movie that looks interesting.
Here’s one thing that I find somewhat telling-films specifically aimed at children seem to be skewed more toward recent releases. Toy Story 3, for instance, is way up at #35, while Toy Story 2 falls off the list, and the original is way down at #135.
One of the definitive Disney classics remains on the list, “The Lion King,” at #117-I don’t know how much of that is due to the attention it’s getting from its re-release. But you don’t see “Snow White,” or “Beauty and the Beast,” on there. What you do see trends heavily toward the last 5 years: Ratatouille, How to Train Your Dragon, Up, and Wall-E, in addition to the aforementioned Toy Story 3. I’d expect to see Monsters, Inc. and The Incredibles drop off the list soon, and Ratatouille and How to Train should probably slide down significantly.
Generally, I would imagine a well written movie targeted at kids to be a good bet for an instant splash, especially if it’s good enough that somewhat older audiences who see it will also enjoy it. But those will have limited staying power, as the most effective audience will have aged out of their devotion to them.