 2. Counting Cruise
I chose Tom Cruise’s career to compare with Nic Cage for a couple of reasons: 1) he’s roughly the same age as Nic Cage and 2) the average person would probably guess that Tom Cruise’s movie output, though not without fault, is certainly more consistently higher quality than that of the erratic Cage.
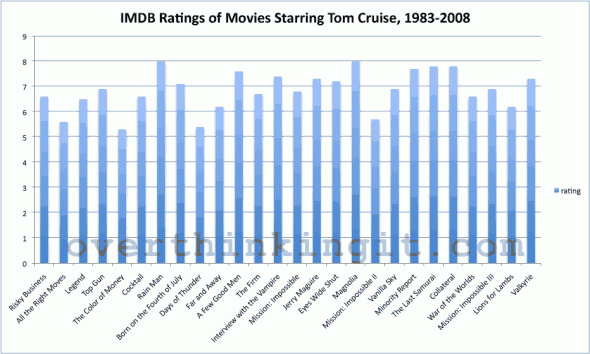
Let’s put that assumption to the test. From 1983’s Risky Business to 2008’s Valkyrie, Tom Cruise starred in 26 movies…
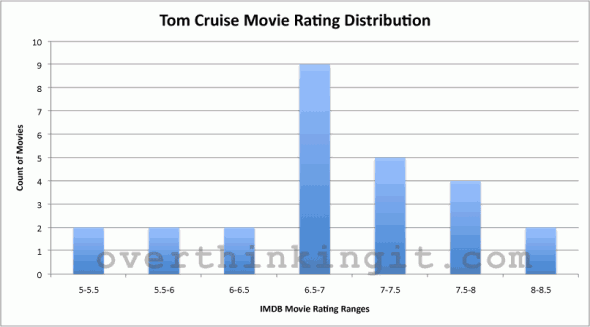
…whose distribution seems at first glance to suggest a higher movie quality than Nic Cage:

And sure enough, the vital stats bear this out:
Average: 6.85
Median: 6.9
Standard Deviation of Cruise: 0.78
So not only do Tom Cruise’s movies have higher average and median ratings, the “Standard Deviation of Cruise” is slightly smaller than the “Standard Deviation of Cage.” The assumption, then, that Cruise makes better movies more consistently than Nic Cage, seems to have some quantitative evidence.
But clearly it can’t be this simple.


I dunno, I think Cruise is a better comparison than Hanks, because people may love him now, but you can see by his early career that he made Splash, then a bunch of mediocre movies that are on TNT at 2pm on a Tuesday, then Big, then more kinda shitty movies that either no one watches or are punchlines like Turner & Hooch, then he made League of Their Own and launched up into consistent good or popcorn-good movies. The Tom Hanks as man-child he was rocking in the 80s was really hit or miss; the Tom Hanks as guy who’s lived some life and doesn’t fuck around yet is still likable and charming is a solid movie leading man.
Very interesting article. The one minor quibble I would have is that the rating of a movie doesn’t necessarily correspond to the actor’s performance, since I’ve seen some great performances in utterly horrible stories. (For example, I always think of the blond guy in “Battlefield Earth” and poor Colin Baker as the 6th Doctor in “Doctor Who.”) However, I think at this point in their careers, the three gentlemen you point out have much more control over this sort of thing than your average actor, so I’ll go with it as an overall premise for this sort of thing anyway.
One thing that I would love to see examined more was that it seems like Tom Hanks’s graph actually seems to indicated that he has either a) chosen better movies later in his career or b) actually grown as an actor. Even the relative “stinker” of “You’ve Got Mail” is actually higher than most of his early work. This does not seem to be the same for the other two, who seem fairly consistent across time. I don’t know enough about stats to say for sure if this is fair, but it would be an interesting exercise to chart this sort of thing for several big-time and small-time actors and actresses. Who’s growing and who’s staying steady?
I agree with the above – change (or lack thereof) in time across a career could be an interesting factor. Can we get a trendline for these guys? Or maybe time-chunked analyses with a big break movie or Academy Award as dividing lines, maybe with a brief grace period after such events to take into consideration crap filmed before people took you more seriously as an actor?
One thing possibly overlooked with here are the outliers. This is hidden in your graphs and histograms because you change your scales across the different actors’ graphs.
Look at the stats again – Hanks has two films ranked over 8.5, and one further over 8; Cruise has two ranked over 8, while Cage has 0. At the other end of the scale, Cage has four films ranked under 5, whilst the other two have none.
So maybe these outlying films over-influence general perception: a career is remembered overall more favourably where there are some real corkers (or, do Rain Man and people will forgive you for cashing in on MI:2), and overall more negatively when there are some stinkers (or, crap on the memory of the Wickerman and I don’t care how good Leaving Las Vegas was)
The above comments are also valid, particularly in Hanks case when you look at the spread of the quality of his films.
and by “…True stinkers like Matchstick Men…” you mean “…True stinkers like The Wicker Man…”, right?. Because Matchstick Men was pretty great IMHO, and IMDb’ers seem to agree
also, do you have the raw data in, say, google docs? because i’d like to take a look, but i’m to lazy to compile it again myself
As a certified Cage-hater, I have to make some quibbles with the article, though I appreciate subjecting Nick Cage’s terribleness to rigorous scrutiny.
1. Though there are obviously no objective scores for quality of movies, I would take National Treasure (which scored just under a 7 in IMDB) as a classic “Bad Nick Cage movie”. Perhaps the haters have different taste from the general public (I would call it “good” taste, but that’s just me :-)?
2. The galling thing about Nick Cage is not that he has been in bad movies, it’s that he is so bad in them. Cruise and Hanks, even in bad movies, at least put in a competent, non-annoying performance. Nick Cage’s persona (that carries across many of his recent movies) is extremely annoying.
3. In all of his bad movies he plays the same character: the know-it-all nerd-turned-action hero. What’s up with that?
I think we need an unbelievably unfair comparison or two to give real meaning to the statistics. What do Brad Pitt’s graphs look like?
Also, Nicolas Cage has been in more movies than either of the other two in this article. What effect does that have on things?
The analysis as it stands lacks meaning without a good frame of reference.
@pFransk, Thanks for pointing that out. Though you should have begun your statement with “well, actually.” ;-) Corrected in the article.
I’ll release the raw data tonight and possibly post some additional graphs tonight if others want to get their hands dirty with the data.
@MaxPolun, I’d love to hear more about the phenomenon of Cage-hating in general. Is part of the Cage backlash that he’s in so freaking many movies? 45 starring roles (as measured by “appears prominently on the DVD cover both in name and in picture”) over the course of 15 years = 3 movies per year. And I even excluded a few minor roles and animation voice work.
Is he spreading himself too thin? Or made more annoying by his ubiquity?
As for “National Treasure,” I refer you to a brief analysis I did of that movie as a “benchmark movie;” that is, a movie in which every great thing about is balanced out by something equally terrible:
http://www.overthinkingit.com/2009/10/23/benchmark-movies/3/
I should begin by say that I *am* a statistician. Overall I like this comparison as a rough means to gain insight. There are all kinds of ways to complicate it; a truly thorough analysis would control for other factors such as director, film budget, and costars. However, the simplicity of this approach makes it easy to get a sense of where the actors’ relative output stand.
That said, Clio is 100% right about Tom Hanks. His graph clearly has what we statisticians call a structural break occurring at A League of Their Own. Hanks’ average film quality take a huge leap at this point, which is why the histogram you plot has multiple peaks. While Cruise and Cage seem to be drawing from the same distribution over time (with a possible upward trend in Cruise’s case? hard to tell without more complex analysis), Hanks experiences a jump between two distributions which, I suspect, would each in themselves have a lower SD than either of the other actors.
My point is that, once we take into account the huge shift in Hanks’ career, I believe Cage has a lower average quality AND a higher SD than either of the others. Now, whether the difference is what we call “statistically significant” is another question entirely ;)
Surely you meant “data current as of January 11, 2010” not “2009”?
@Turin: Corrected in the article. That pretty much applies to every single date that I’ve written out in the first months of this new year.
@Greg: I agree that more comparisons would have been better, which I would have done if I had more time/resources.
Readers, this is why you should buy more t-shirts and crap on Amazon! Then we could hire a research assistant–AND a copy checker!
OK stats people, here’s the raw data. Knock yourselves out:
http://spreadsheets.google.com/ccc?key=0AuMWmmHpW80UdGRKOUpJSmdhLVdZdi1DR3J2MFVwdUE&hl=en
(there are some tabs with the remnants of Excel pivot tables, which obviously aren’t supported in Google Docs.)
Lee: did you manually copy the data from IMDb, page by page?
Yup. To my knowledge, there aren’t any shortcuts to directly accessing the IMDB ratings database.
For the analysis I did on the top 250 list, that was mostly a copy-paste job from the display on the IMDB website (with some complications/data massaging).
And while we’re on the topic of manual data entry, the Peak Rock/Rolling Stones 500 data entry was… almost 100 percent manual.
Just FYI, I tried this same analysis on 37 of Brad Pitt’s films from 1989 through 1999 (excluded TV and voice-only work). I realize the time frame is different, but his average came out between Hanks and Cruise, and his standard deviation was 1.25!
So, if we want to talk about someone who isn’t reliable… maybe Nic Cage isn’t the best target after all.
No matter what is said, who would I sleep with? Cruise, Hanks or Cage? Cage wins…